Each night on the news the weather man shows a video clip of a storm that came through or will come through. The images that they show on the news are produced using radar signals. NEXt generation RADar (NEXRAD) is a tool that is used to show storms on the weather channel, but it also has an application in hydrologic modeling. The data obtained by these radar signals is converted to precipitation totals. The NOAA website enables users to obtain grids of spatially varying rainfall for use in hydrologic models such as HMS and GSSHA. In this assignment you will be given a set of rainfall grids that corresponds to the same July 18, 2000 storm you modeled in the previous assignments. You will compare these results with those obtained using gage data.
Getting Started
In WMS, open the project file you created for the MODClark Analysis in the assignment on HMS precipitation, or create the ModClark simulation again. An important thing to know in using the NEXRAD data is that a 2-D grid must be defined. This means that the model must be a MODClark model for HMS (you should already have a 100 by 100 grid with a uniform and the curve number of 99). When you select "Gridded Precipitation" under the Meteorological parameters menu, the following screen will appear.
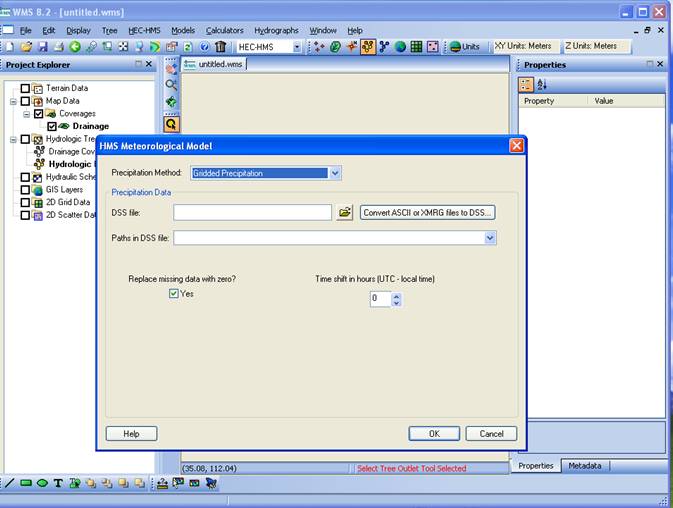
Since the time for the grids are based on Greenwich mean time (GMT) you must offset the time by +6 hr. Change the time shift to +6 to make the time reflect when the event actually took place so we can compare the hydrographs that were based on a 24 hour storm event. After that you will click on the Convert ASCII to DSS. (this is for preparing the HMS file) (Click here for the NEXRAD data)
For GSSHA, begin with the same base model you used in the GSSHA Precipitation assignment. In using the gridded data in GSSHA you will have to make the shift on your own so the times will line up correctly. This means that in the "Convert ASCII to..." dialog box the start time should be 6:08 P.M. July 18, 2000. (the data for the grid says the start time is 12:08 A.M. July 19, 2000)
From this point the xmswiki has good instructions for both GSSHA and HMS. Click here to go to the instructions.
Assignment
Once you have the basic setup of your HMS and GSSHA models established you should perform the following analyses:
-
Determine the outflow hydrograph as computed in HMS.
-
Determine the outflow hydrograph as computed in GSSHA
To turn in with modeling work:
-
Hydrographs showing the results of using NEXRAD data. Download the template found here and copy and paste in your runoff hydrograph values from WMS in the appropriate columns. The only new results are the results that go in the NEXRAD columns (one for HMS and one for GSSHA). You can copy your results from the previous precipitation assignments for the other columns.
- Compare your results with your results in the previous assignment.
-
Compare how spatial rainfall data affects the hydrographs in HMS and GSSHA.
-
Does spatially distributed rainfall data affect HMS or GSSHA more? Comments?